
Chapter 3 from our report summarizing the lessons we learned on the Great American Adaptation Road Trip. We partnered with the Georgetown University Climate Center to get this to you. Chapter 4 coming soon.
Take-home lesson #3: Climate science is more likely to be used when it is at the appropriate geographic and temporal scale for local decision-makers.
A common barrier to building local climate preparedness is that scientific information about climate change, produced by researchers around the world and summarized by groups such as the Intergovernmental Panel on Climate Change, tends to span large geographic scales, typically global or continental, as well as long timeframes. Temperature and sea-level rise projections are often presented for the year 2100 and sometimes 2050 at the global and national levels, and communities have difficulty interpreting how broad-scale information relates to their local risks. Communities need ways to facilitate action at their local scale and on shorter planning horizons, or even briefer electoral timeframes.
To overcome this information gap, efforts to scale down the global climate science to the local decision-making scale are gaining popularity. The latest nationally coordinated effort to downscale the national and global climate data—the 2014 U.S. National Climate Assessment —provides regional trends and projections. At an even finer scale, community organizations and experts are compiling local climate data, sometimes from longstanding sources of information such as tide gauges, weather stations, or farm records. Increasingly, academic researchers are employing complex statistical techniques that use local climate and geographic data together with existing global climate models, like those in the Intergovernmental Panel on Climate Change (IPCC) reports, to project future scenarios at a high-resolution local scale. By partnering with academic institutions, local decision-makers can obtain downscaled climate data and get help aggregating the sometimes overwhelming amount of information that exists through maps and other useful data communication methods. When governments and organizations collect local climate data or develop a climate study together with a nearby university, the scientific product is much more usable than what would have been produced without input from the entities that ultimately need to make decisions based on the data.

Dr. Dave Burdick measures elevation to assess flood risk in Portsmouth, New Hampshire
Localized climate trends, models, and scenarios make the effects of climate change relevant to local contexts and facilitate action to prepare. For example, grant funding secured by the city of Portsmouth, New Hampshire was used to commission a study by experts at the University of New Hampshire and the Rockingham County Regional Planning Commission, which uses nearby tide gauge data and local subsidence rates to show that sea levels have historically risen 0.7 inches per decade. The researchers ran the local data through low and high carbon emissions scenario models used by the IPCC to determine that the rate of sea-level rise is expected to accelerate in Portsmouth and total rise will likely reach 1 foot to 1.7 feet between 2010 and 2050. The study shows that the localized rate of relative sea-level rise in Portsmouth will be slightly slower than in Boston but faster than in the Pacific Northwest due to differences in local subsidence rates, among other factors. This sea-level rise information was used by local planners to conduct a vulnerability assessment. A modified version of the vulnerability assessment is expected to be included as a chapter in Portsmouth’s 2015 Master Plan and the Public Works Department has recognized the need to use the new information to prioritize capital projects. By partnering with local experts, including university researchers, local governments are getting creative about how to improve knowledge at the most relevant scale.
Implementation tip #3: Consider partnering with a nearby college or university to fill information gaps about local climate impacts and answer questions about the best ways to respond and prepare.
Scaled-down spatial data can also be a useful tool for local planning and communication. For instance, the Adaptation Strategy for the Blackwater National Wildlife Refuge in Maryland, produced jointly by The Conservation Fund and the Audubon Society, used the Sea-level rise Affecting Marshes Model (SLAMM) to map the dramatic conversion of marsh habitat to open water over the coming decades with sea-level rise. The color-coded maps also help to visualize a strategy: they show where marsh restoration may be ecologically and economically feasible, and where conservation easements could be used to protect areas for marshes to migrate inland. As more spatial datasets related to climate change become publically available and as more practitioners are trained in Geographic Information Systems (GIS) analysis, maps will be an increasingly important tool for not just understanding climate impacts, but also selecting adaptation strategies to pursue.
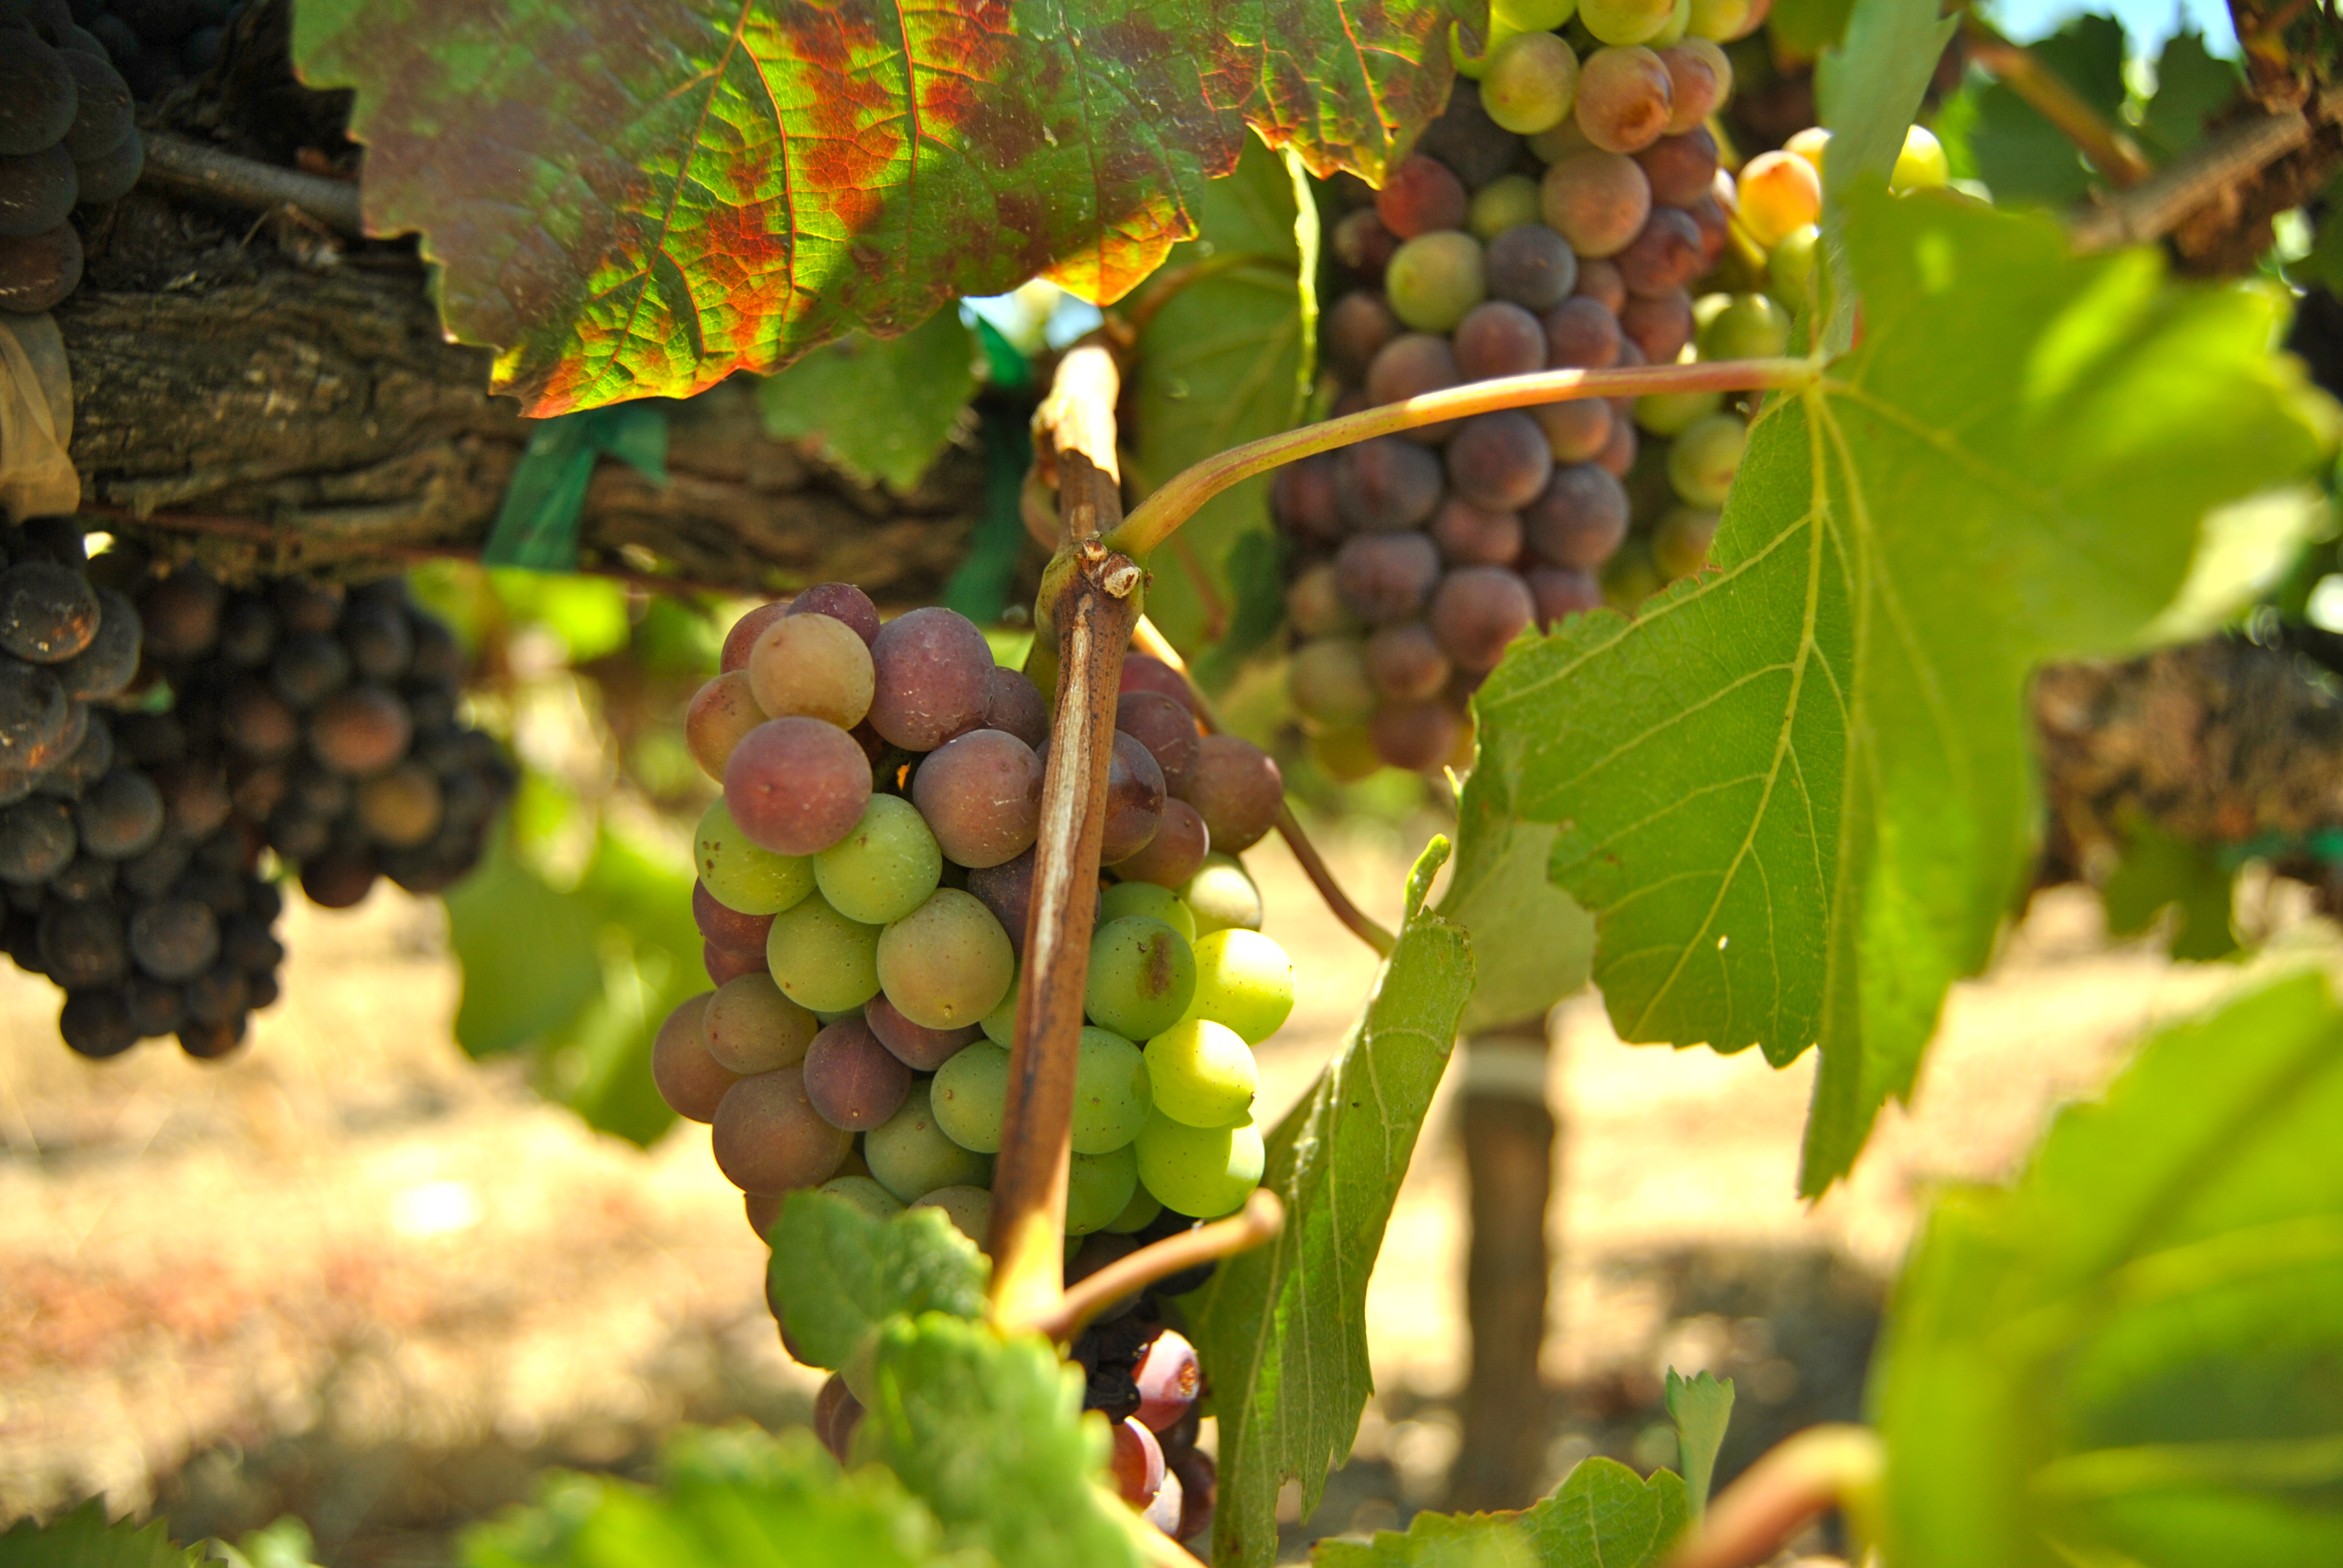
These grapes will make delicious wine thanks to the Napa Valley, California micro-climate
Localized climate information can be especially relevant for businesses whose bottom lines depend on climate futures. After two studies and a series of worrying headlines indicated that climate change could drastically decrease grape production in California, the Napa Valley Vintners (NVV) Association partnered with researchers at UC San Diego to better understand past temperature trends on a smaller scale that would more accurately capture their unique valley climate. Since growers plant on a 25-year timescale, if they make the wrong decisions about which variety of grapes to plant in anticipation of climate impacts they could face large financial losses. Researchers spent three years collecting data from the nearest weather stations and going door to door, sifting through old notebooks to uncover historical data about when vintners planted and harvested over past decades.
“The very thing that makes premium wine grape growing happen is the very thing that often gets ignored [in climate studies],” Patsy McGaughy, the communications director at NVV, said, referring to the complex micro-climate of Napa Valley that can only be understood accurately with detailed local information.
Localized climate science serves several purposes. In some cases, downscaled science is a motivator; it helps educate communities and instigate coordination, planning efforts, and action where they did not previously exist. In Napa Valley, it wasn’t until the initial studies were released highlighting the potential vulnerability of grapes that vintners got together to coordinate around the issue. In other cases, localized science provides justification for new planning efforts and discrete recommendations in plans. Local climate impacts laid out in the Hazard Mitigation and Climate Adaptation Action Plan for Lewes, Delaware give the plan credibility. By pointing to extreme precipitation estimates or local sea-level rise data, local officials may be more able to persuade the city council, residents, and other important decision-makers to support and fund recommended actions.
However, much more work is needed to make climate science truly salient to local level decision-making. In less populated places that lack resources and do not have an affiliate university or organization funding a climate study, localized data can be hard to come by. For example, in Paonia and Hotchkiss, Colorado, small towns dependent on fruit crops, little climate science exists, even about the climatic factors that can make or break the economy of the region: season length and late spring frosts. Dr. Ron Godin, an agronomist at the Colorado State University Agricultural Extension, has shown with rough calculations that the growing season is, on average, four weeks longer than it was three decades ago—which may explain why the late spring frosts have recently been hitting fruit buds at more critical growth stages. But Godin’s estimate is based on limited data and is not well publicized to local farmers. Godin explained that more local research is needed that captures the intricate micro-climates within the North Fork Valley, because local farmers are skeptical about using science transferred from other places to make decisions about crop varieties or technology investments.

Allie eats a peach grown in Paonia, Colorado’s special climate
Though there is a desire and need for higher resolution climate information, a perceived need for better scientific information can sometimes be used as a tactic to defer necessary action. It is therefore important to recognize when decision-makers have enough scientific information to make a decision. This may mean being clear beforehand about how the findings in a commissioned study will be used for planning purposes. Or, it may mean moving forward with ‘low-regrets’ actions—such as conserving more of Maryland’s stunning coastal landscape.
“What’s the worst that could happen?” asked Erik Meyers, Vice President of The Conservation Fund. “You protect all this great open space and it doesn’t convert to marsh immediately. The science isn’t perfect and the map isn’t perfect, but we have enough information to move forward.”
